
Composr Tutorial: Activity statistics for your site (analytics)
Written by Philip Withnall (ocProducts)
Lots of statistics types are available
(Click to enlarge)
The administration module
The administration module resides in Admin Zone > Audit > Site statistics.Be aware that hits coming from the web server itself will be filtered from the stats, so if you are running a web server on your own computer you may not see any results if nobody else has used your website yet.
Installing geo-location data
The message shown when installing geolocation data
(Click to enlarge)
The menu link to install geolocation data

(Click to enlarge)
Important – keep it going
Do not disturb the geolocation data installation process. You will be informed when it is complete.
Once the geo-location data is installed, all the extra statistics can be used.
Page view statistics
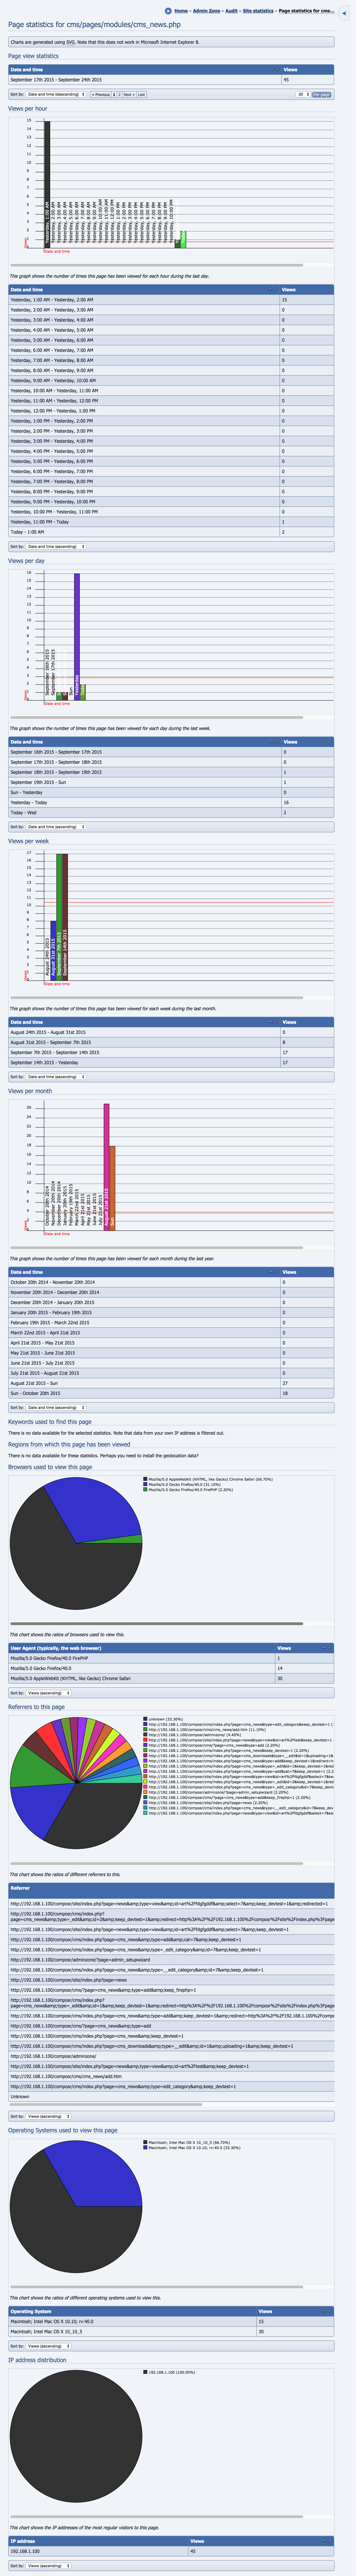
Stats data for a particular page
(Click to enlarge)
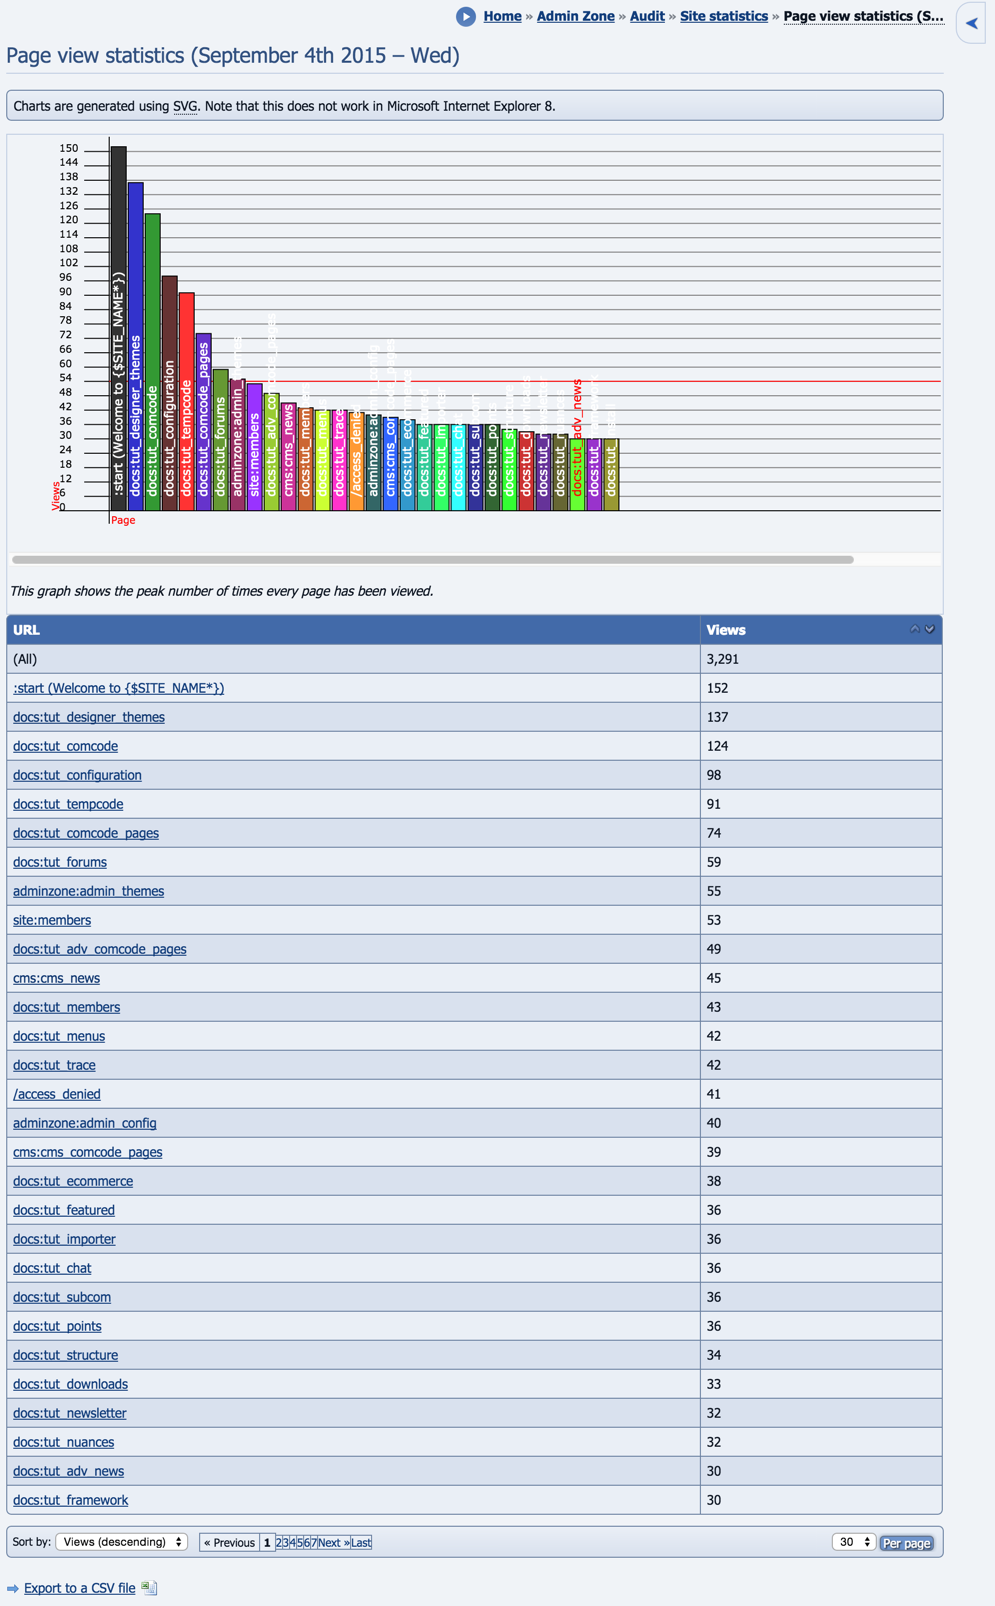
List of pages with stats data
(Click to enlarge)
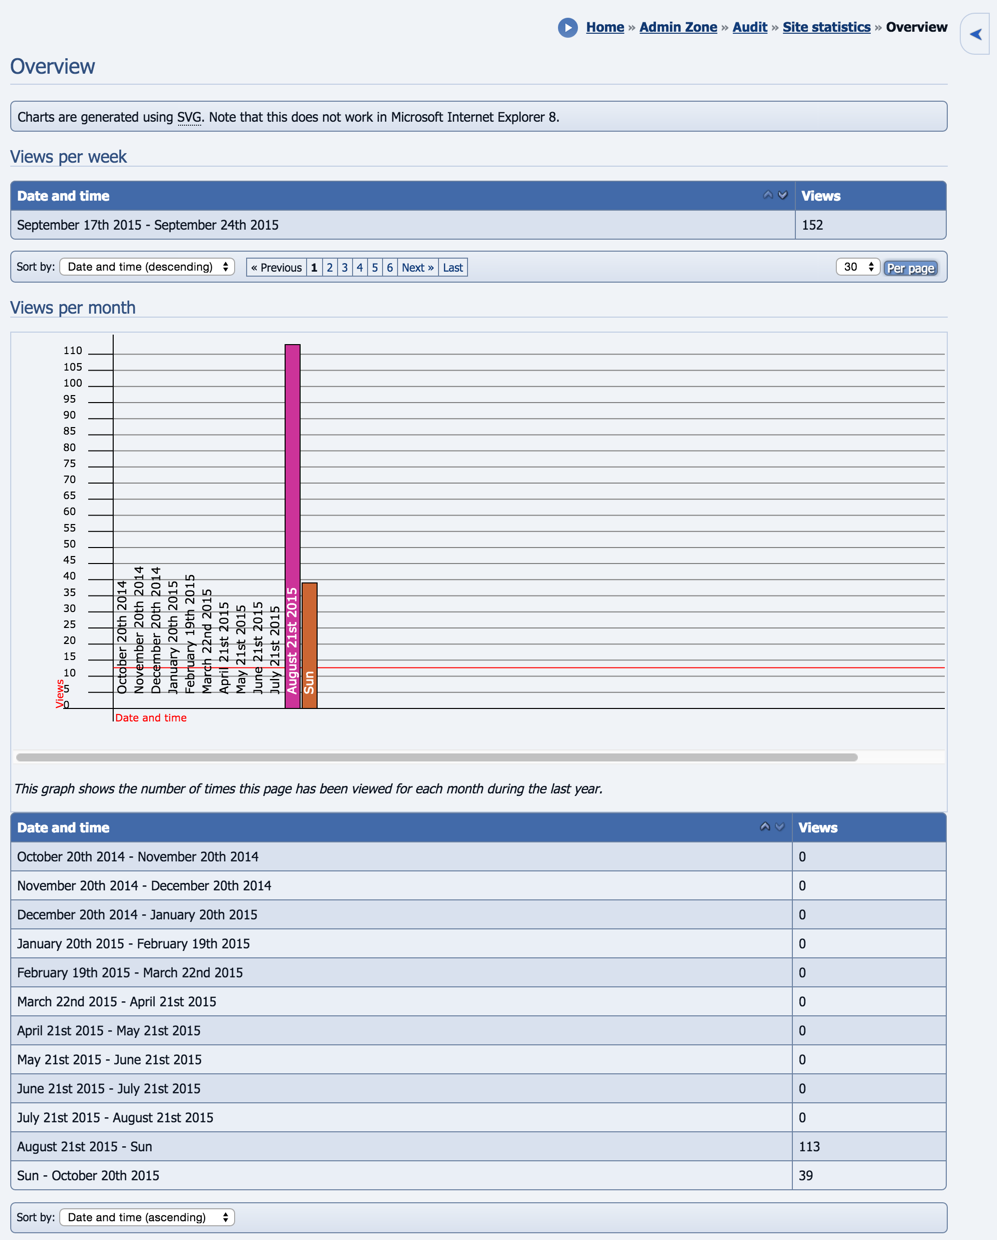
Overview stats
(Click to enlarge)
Per-page breakdowns
The per-page breakdowns list more detailed statistics for each page, in various forms, but all have a graph. The following statistics are present:- Views per hour
- Views per day
- Views per week
- Views per month
- Browsers used to view this page
- Referrers to this page
- Operating Systems used to view this page
- Regions this page has been viewed from
Users online statistics
This statistics screen shows a line-graph of the number of users online for each day, with a text-listing of the same statistics below. Such data can be used to analyze when greater or fewer numbers of people come to visit your site. Please note it can only detect when user online records are set, not keep a constant track – i.e. you will see increasing peaks, but will not see if it goes down.Submission statistics
This statistics screen shows a line-graph of the number of submissions for each day, with a text-listing of the same statistics below. Such data can be used to analyze when (and why) people submit to your site.Top referrers
This statistics screen shows a pie chart of the top referrers to the site, with a text-listing of the same statistics below. Such data is invaluable in finding out where to get your site advertised, which advertising schemes aren't working, etc.Top Google keywords
This statistics screen shows a pie chart of the top Google keywords used to find the site, with a text-listing of the same statistics below. Such data helps you see how to refine your website to be better in tune with what people are searching for.Page load times
This statistics screen shows a bar chart of how long each page (at minimum) takes to be generated and outputted. This is useful for optimizing your site; finding bottlenecks and jams, where things could be spread out more (e.g. putting fifteen blocks on different pages, instead of the same one).Download statistics
The download statistics box
(Click to enlarge)
There are two methods for revealing download trends to your visitors:
- Download statistics are generally available on an individual download page
- You can also pull out key downloads for the benefit of your visitors is to use one of the download blocks: most popular downloads, and most recently-added downloads. These are explained below.
Other statistics
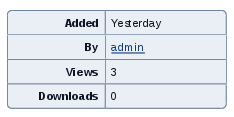
View statistics are shown for various forms of content

(Click to enlarge)
An example of this would be news entries: each news entry records how many times it is viewed, and displays this number on its view screen.
Conversr statistics
The following statistics screens exist to show Conversr data:- Demographics (summarise the ages of your members)
- Posting rates (identify trends in daily posting rates)
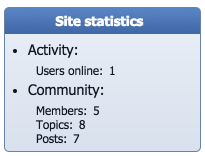
The statistics block
The side_stats block
(Click to enlarge)
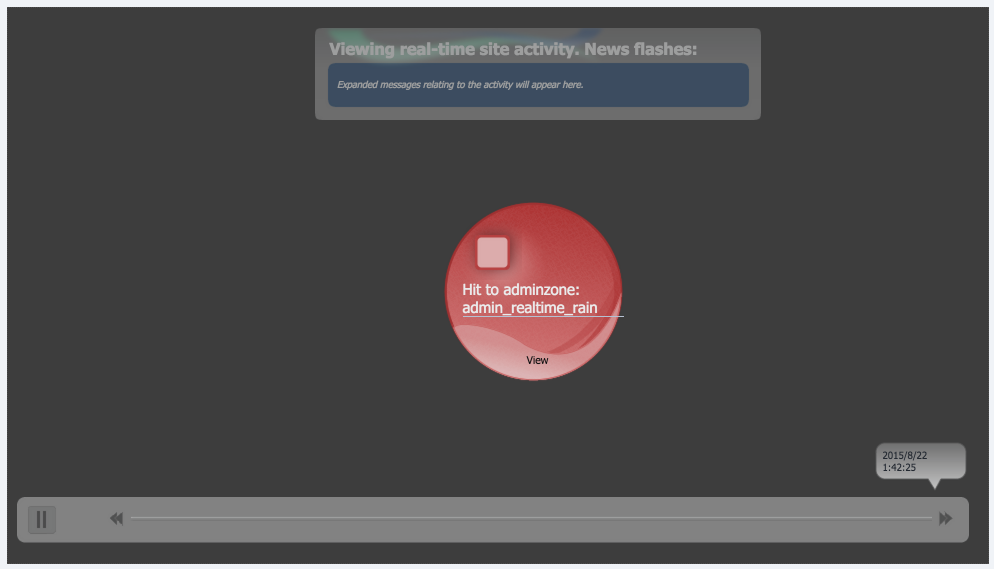
Real-time analytics
Real-time analytics
(Click to enlarge)
Access Real-time analytics from:
Admin Zone > Audit > What's happening now (RTR)
It is a good way to visualise how people are using the site. This works best when the site has multiple online users performing options, but you can move the timeline back to when stuff was happening previously (i.e. view activity from a historic viewpoint).
Google Analytics
Google Analytics is an excellent free package for analysing website activity, allowing you to spot all kinds of trends in your data.We don't consider Google Analytics a competitor to our own inbuilt analytics – both offer different features, complementing each other. Google Analytics is easy to install, we have support built-in so you just need to enter your analytics code in the Composr configuration.
Concepts
- SVG
- Scalable Vector Graphics, a text-markup-based graphics format that allows infinite scalability of graphics without texture loss due to being vector-based (co-ordinate-delimited shapes) instead of pixel based (specific data for each pixel).
- Geo-location
- The process of using some type of individually-identifiable information to find out where in the world somebody is.
See also
- Using IP addresses to trace users
- Analytics and split testing – using Google Analytics
- http://www.razorsocial…al-media-analytics-tools/
Feedback
Please rate this tutorial:
Have a suggestion? Report an issue on the tracker.